Monday, February 7, 2022

Calculate Feature Importance With Python

 Code 1

(.env) [boris@fedora34server NUMPY]$ cat foresTree1.py

# decision tree for feature importance on a regression problem

from sklearn.datasets import make_regression

from sklearn.tree import DecisionTreeRegressor

from matplotlib import pyplot

# define dataset

X, y = make_regression(n_samples=1000, n_features=10, n_informative=5, random_state=1)

# define the model

model = DecisionTreeRegressor()

# fit the model

model.fit(X, y)

# get importance

importance = model.feature_importances_

# summarize feature importance

for i,v in enumerate(importance):

        print('Feature: %0d, Score: %.5f' % (i,v))

# plot feature importance

pyplot.bar([x for x in range(len(importance))], importance)

pyplot.show()


*********************
Code 2

(.env) [boris@fedora34server NUMPY]$ cat foresTree2.py

# decision tree for feature importance on a classification problem

from sklearn.datasets import make_classification

from sklearn.tree import DecisionTreeClassifier

from matplotlib import pyplot

# define dataset
X, y = make_classification(n_samples=1000, n_features=10, n_informative=5, n_redundant=5, random_state=1)

# define the model
model = DecisionTreeClassifier()

# fit the model
model.fit(X, y)

# get importance
importance = model.feature_importances_

# summarize feature importance
for i,v in enumerate(importance):
        print('Feature: %0d, Score: %.5f' % (i,v))

# plot feature importance
pyplot.bar([x for x in range(len(importance))], importance)
pyplot.show()


References

Linear vs nonlinear neural network

Code 1 

(.env) [boris@fedora34server NUMPY]$ python NonLinear.py

input: [0 0] - output: [0.]

input: [0 1] - output: [1.]

input: [1 0] - output: [1.]

input: [1 1] - output: [-0.]

(.env) [boris@fedora34server NUMPY]$ cat NonLinear.py

import numpy as np


#Data

data = np.array([[0, 0, 0],[0, 1, 1],[1, 0, 1],[1, 1, 0]])

np.random.shuffle(data)

train_data = data[:,:2]

target_data = data[:,2]


#XOR architecture

class XOR_class():


    def __init__(self, train_data, target_data, alpha=.1, epochs=10000):

        self.train_data = train_data

        self.target_data = target_data

        self.alpha = alpha

        self.epochs = epochs


        #Random weights

        self.W0 = np.random.uniform(low=-1, high=1, size=(2)).T

        self.b0 = np.random.uniform(low=-1, high=1, size=(1))

        self.W2 = np.random.uniform(low=-1, high=1, size=(2)).T

        self.b2 = np.random.uniform(low=-1, high=1, size=(1))


    #xor network (linear transfer functions only)

    def xor_network(self, X0):

        n0 = np.dot(X0, self.W0) + self.b0

        X1 = n0*X0

        a = np.dot(X1, self.W2) + self.b2

        return(a, X1)


    #Training the xor network

    def train(self):

        for epoch in range(self.epochs):

            for i in range(len(self.train_data)):

                # Forward Propagation:

                X0 = self.train_data[i]

                a, X1 = self.xor_network(X0)


                # Backward Propagation:

                e = self.target_data[i] - a

                s_2 = -2*e


                # Update Weights:

                self.W0 = self.W0 - (self.alpha*s_2*X0)

                self.b0 = self.b0 - (self.alpha*s_2)

                self.W2 = self.W2 - (self.alpha*s_2*X1)

                self.b2 = self.b2 - (self.alpha*s_2)


        #Restart training if we get lost in the parameter space.

        if np.isnan(a) or (a > 1) or (a < -1):

            print('Bad initialization, reinitializing.')

            self.W0 = np.random.uniform(low=-1, high=1, size=(2)).T

            self.b0 = np.random.uniform(low=-1, high=1, size=(1))

            self.W2 = np.random.uniform(low=-1, high=1, size=(2)).T

            self.b2 = np.random.uniform(low=-1, high=1, size=(1))

            self.train()


    #Predicting using the trained weights.

    def predict(self, test_data):

        for i in train_data:

            a, X1 = self.xor_network(i)

            #I cut off decimals past 12 for convienience, not necessary.

            print(f'input: {i} - output: {np.round(a, 12)}')


# Execution

xor = XOR_class(train_data, target_data)

xor.train()

np.random.shuffle(data)

test_data = data[:,:2]

xor.predict(test_data)


References


Wednesday, February 2, 2022

Vanishing Gradients Problem Using the ReLU

 Code 1

(.env) [boris@fedora34server NUMPY]$ cat vahish2Issue1.py

# scatter plot of the circles dataset with points colored by class

from sklearn.datasets import make_circles

from numpy import where

from matplotlib import pyplot

# generate circles

X, y = make_circles(n_samples=1000, noise=0.1, random_state=1)

# select indices of points with each class label

for i in range(2):

        samples_ix = where(y == i)

        pyplot.scatter(X[samples_ix, 0], X[samples_ix, 1], label=str(i))

pyplot.legend()

pyplot.show()

****************

Code 2

(.env) [boris@fedora34server NUMPY]$ cat vahish2Issue2.py

# mlp for the two circles classification problem

from sklearn.datasets import make_circles

from sklearn.preprocessing import MinMaxScaler

from keras.layers import Dense

from keras.models import Sequential

from tensorflow.keras.optimizers import SGD

from keras.initializers import RandomUniform

from matplotlib import pyplot

# generate 2d classification dataset

X, y = make_circles(n_samples=1000, noise=0.1, random_state=1)

# scale input data to [-1,1]

scaler = MinMaxScaler(feature_range=(-1, 1))

X = scaler.fit_transform(X)

# split into train and test

n_train = 500

trainX, testX = X[:n_train, :], X[n_train:, :]

trainy, testy = y[:n_train], y[n_train:]

# define model

model = Sequential()

init = RandomUniform(minval=0, maxval=1)

model.add(Dense(5, input_dim=2, activation='tanh', kernel_initializer=init))

model.add(Dense(1, activation='sigmoid', kernel_initializer=init))

# compile model

opt = SGD(learning_rate=0.01, momentum=0.9)

model.compile(loss='binary_crossentropy', optimizer=opt, metrics=['accuracy'])

# fit model

history = model.fit(trainX, trainy, validation_data=(testX, testy), epochs=500, verbose=0)

# evaluate the model

_, train_acc = model.evaluate(trainX, trainy, verbose=0)

_, test_acc = model.evaluate(testX, testy, verbose=0)

print('Train: %.3f, Test: %.3f' % (train_acc, test_acc))

# plot training history

pyplot.plot(history.history['accuracy'], label='train')

pyplot.plot(history.history['val_accuracy'], label='test')

pyplot.legend()

pyplot.show()

*****************

Code 3

(.env) [boris@fedora34server NUMPY]$ cat vahish2Issue3.py

# deeper mlp for the two circles classification problem

from sklearn.datasets import make_circles

from sklearn.preprocessing import MinMaxScaler

from keras.layers import Dense

from keras.models import Sequential

from tensorflow.keras.optimizers import SGD

from keras.initializers import RandomUniform

from matplotlib import pyplot

# generate 2d classification dataset

X, y = make_circles(n_samples=1000, noise=0.1, random_state=1)

scaler = MinMaxScaler(feature_range=(-1, 1))

X = scaler.fit_transform(X)

# split into train and test

n_train = 500

trainX, testX = X[:n_train, :], X[n_train:, :]

trainy, testy = y[:n_train], y[n_train:]

# define model

init = RandomUniform(minval=0, maxval=1)

model = Sequential()

model.add(Dense(5, input_dim=2, activation='tanh', kernel_initializer=init))

model.add(Dense(5, activation='tanh', kernel_initializer=init))

model.add(Dense(5, activation='tanh', kernel_initializer=init))

model.add(Dense(5, activation='tanh', kernel_initializer=init))

model.add(Dense(5, activation='tanh', kernel_initializer=init))

model.add(Dense(1, activation='sigmoid', kernel_initializer=init))

# compile model

opt = SGD(learning_rate=0.01, momentum=0.9)

model.compile(loss='binary_crossentropy', optimizer=opt, metrics=['accuracy'])

# fit model

history = model.fit(trainX, trainy, validation_data=(testX, testy), epochs=500, verbose=0)

# evaluate the model

_, train_acc = model.evaluate(trainX, trainy, verbose=0)

_, test_acc = model.evaluate(testX, testy, verbose=0)

print('Train: %.3f, Test: %.3f' % (train_acc, test_acc))

# plot training history

pyplot.plot(history.history['accuracy'], label='train')

pyplot.plot(history.history['val_accuracy'], label='test')

pyplot.legend()

pyplot.show()

**************

Code5

(.env) [boris@fedora34server NUMPY]$ cat vahish2Issue5.py

# deeper mlp with relu for the two circles classification problem

from sklearn.datasets import make_circles

from sklearn.preprocessing import MinMaxScaler

from keras.layers import Dense

from keras.models import Sequential

from tensorflow.keras.optimizers import SGD

from keras.initializers import RandomUniform

from matplotlib import pyplot

# generate 2d classification dataset

X, y = make_circles(n_samples=1000, noise=0.1, random_state=1)

scaler = MinMaxScaler(feature_range=(-1, 1))

X = scaler.fit_transform(X)

# split into train and test

n_train = 500

trainX, testX = X[:n_train, :], X[n_train:, :]

trainy, testy = y[:n_train], y[n_train:]

# define model

model = Sequential()

model.add(Dense(5, input_dim=2, activation='relu', kernel_initializer='he_uniform'))

model.add(Dense(5, activation='relu', kernel_initializer='he_uniform'))

model.add(Dense(5, activation='relu', kernel_initializer='he_uniform'))

model.add(Dense(5, activation='relu', kernel_initializer='he_uniform'))

model.add(Dense(5, activation='relu', kernel_initializer='he_uniform'))

model.add(Dense(1, activation='sigmoid'))

# compile model

opt = SGD(learning_rate=0.01, momentum=0.9)

model.compile(loss='binary_crossentropy', optimizer=opt, metrics=['accuracy'])

# fit model

history = model.fit(trainX, trainy, validation_data=(testX, testy), epochs=500, verbose=0)

# evaluate the model

_, train_acc = model.evaluate(trainX, trainy, verbose=0)

_, test_acc = model.evaluate(testX, testy, verbose=0)

print('Train: %.3f, Test: %.3f' % (train_acc, test_acc))

# plot training history

pyplot.plot(history.history['accuracy'], label='train')

pyplot.plot(history.history['val_accuracy'], label='test')

pyplot.legend()

pyplot.show()

****************

Code 6

(.env) [boris@fedora34server NUMPY]$ cat vahish2Issue10.py

# deeper mlp with relu for the two circles classification problem with callback

from sklearn.datasets import make_circles

from sklearn.preprocessing import MinMaxScaler

from keras.layers import Dense

from keras.models import Sequential

from tensorflow.keras.optimizers import SGD

from keras.callbacks import TensorBoard

# generate 2d classification dataset

X, y = make_circles(n_samples=1000, noise=0.1, random_state=1)

scaler = MinMaxScaler(feature_range=(-1, 1))

X = scaler.fit_transform(X)

# split into train and test

n_train = 500

trainX, testX = X[:n_train, :], X[n_train:, :]

trainy, testy = y[:n_train], y[n_train:]

# define model

model = Sequential()

model.add(Dense(5, input_dim=2, activation='relu', kernel_initializer='he_uniform'))

model.add(Dense(5, activation='relu', kernel_initializer='he_uniform'))

model.add(Dense(5, activation='relu', kernel_initializer='he_uniform'))

model.add(Dense(5, activation='relu', kernel_initializer='he_uniform'))

model.add(Dense(5, activation='relu', kernel_initializer='he_uniform'))

model.add(Dense(1, activation='sigmoid'))

# compile model

opt = SGD(learning_rate=0.01, momentum=0.9)

model.compile(loss='binary_crossentropy', optimizer=opt, metrics=['accuracy'])

# prepare callback

tb = TensorBoard(histogram_freq=1, write_grads=True)

# fit model

model.fit(trainX, trainy, validation_data=(testX, testy), epochs=500, verbose=0, callbacks=[tb])

***********

Как подавить сообщения Пайтон о том , что при наличии GPU производительность может выше за счет AVX2 FMA директивы :-

"This TensorFlow binary is optimized with oneAPI Deep Neural Network Library (oneDNN) to use the following CPU instructions in performance-critical operations: AVX2 FMA"

Добавьте импорт

import os

os.environ['TF_CPP_MIN_LOG_LEVEL'] = '3'

и выполните

$ export TF_CPP_MIN_LOG_LEVEL=2

Run Code 5 


Run Code 6 above

References

Sunday, December 26, 2021

Uploading в цикле Pandas DataFrames в таблицу встроенной базы данных SQLite3 on Python

 Пример кода и выполнения

(.env) [boris@fedora34server PDSQLITE]$ cat YQDatFrms.py

import numpy as np                                                                   

import pandas as pd                                                                  

from datetime import datetime                                                        

import sqlite3                                                                       

conn = sqlite3.connect('flight.db')                                                  

curs = conn.cursor()                                                                 

curs.execute("create table daily_flights (id integer,  \                           departure date, arrival date, number text, route_id integer)") 

conn.commit()                                                                        

for j in range(1,12):                                                                

   df = pd.DataFrame([[j, datetime(2021, j, j+1, 3+j,10) , \               

      datetime(2021, j, j+1, 5+j,15), chr(64+j)+'1', 3*j+2]], \             

           columns=["id", "departure", "arrival", "number",   \

        "route_id"])                   

   df.to_sql("daily_flights", conn, if_exists="append",index = False)                

data = pd.read_sql_query("select * from daily_flights", conn)

print(data)


Wednesday, December 15, 2021

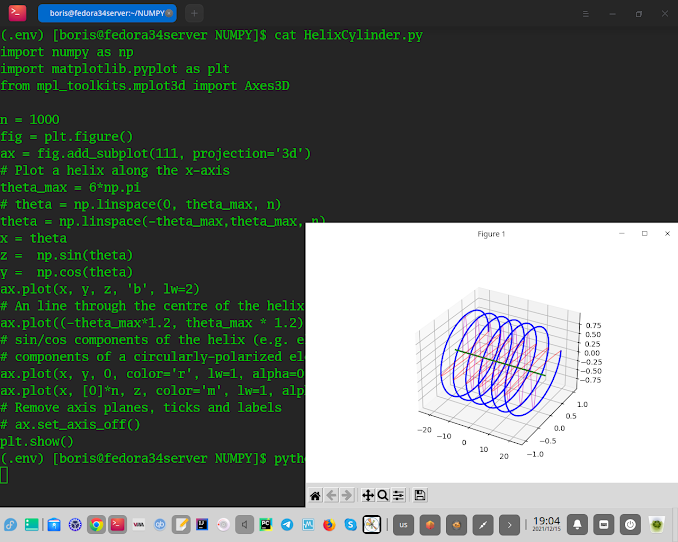
Python depicting a helix via matplotlib and numpy

import numpy as np

import matplotlib.pyplot as plt

from mpl_toolkits.mplot3d import Axes3D

n = 1000

fig = plt.figure()

ax = fig.add_subplot(111, projection='3d')

# Plot a helix along the x-axis

theta_max = 6*np.pi

# theta = np.linspace(0, theta_max, n)

theta = np.linspace(-theta_max,theta_max, n)

x = theta

z =  np.sin(theta)

y =  np.cos(theta)

ax.plot(x, y, z, 'b', lw=2)

# An line through the centre of the helix

ax.plot((-theta_max*1.2, theta_max * 1.2), (0,0), (0,0), color='g', lw=2)

# sin/cos components of the helix (e.g. electric and magnetic field

# components of a circularly-polarized electromagnetic wave

ax.plot(x, y, 0, color='r', lw=1, alpha=0.5)

ax.plot(x, [0]*n, z, color='m', lw=1, alpha=0.5)

# Remove axis planes, ticks and labels

# ax.set_axis_off()

plt.show()


Sunday, December 5, 2021

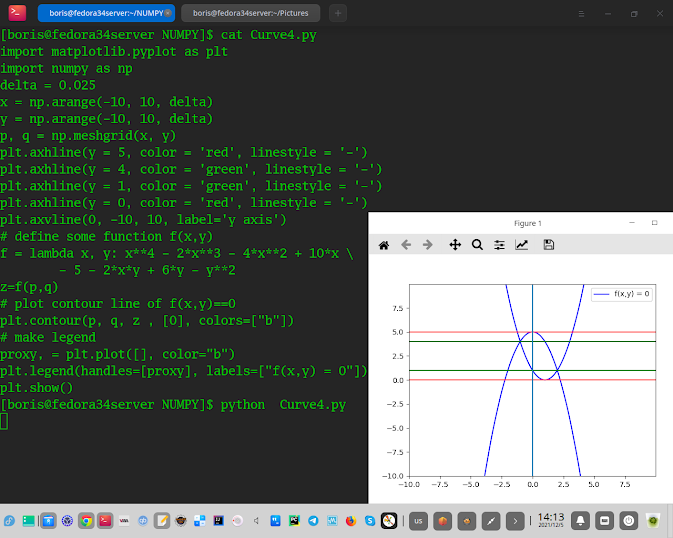
Решение задачи 17 371 Вариант Ларина с помощью Python (numpy,matplotlib)

 Текст задачи


==============

Python code

==============

import matplotlib.pyplot as plt

import numpy as np

delta = 0.025

x = np.arange(-10, 10, delta)

y = np.arange(-10, 10, delta)

p, q = np.meshgrid(x, y)

plt.axhline(y = 5, color = 'red', linestyle = '-')

plt.axhline(y = 4, color = 'green', linestyle = '-')

plt.axhline(y = 1, color = 'green', linestyle = '-')

plt.axhline(y = 0, color = 'red', linestyle = '-')

plt.axvline(0, -10, 10, label='y axis')

# define some function f(x,y)

f = lambda x, y: x**4 - 2*x**3 - 4*x**2 + 10*x \

        - 5 - 2*x*y + 6*y - y**2

z=f(p,q)

# plot contour line of f(x,y)==0

plt.contour(p, q, z , [0], colors=["b"])

# make legend

proxy, = plt.plot([], color="b")

plt.legend(handles=[proxy], labels=["f(x,y) = 0"])

plt.show()


Из плота нетрудно видеть при каких а горизонтальные линии имеют не более 3-ех точек пересения с графиком.

Ответ : а ∈ (-infinity ; 0] ∪ {1;4}∪[5 ; +infinity)


Thursday, December 2, 2021

Метрики для оценки алгоритмов машинного обучения в Python

 (.env) [boris@fedora34server YANDEXQ]$ cat predict.py

import pandas

from sklearn import model_selection

from sklearn.linear_model import LogisticRegression

from sklearn.metrics import classification_report

url = "https://raw.githubusercontent.com/jbrownlee/Datasets/master/pima-indians-diabetes.data.csv"

names = ['preg', 'plas', 'pres', 'skin', 'test', 'mass', 'pedi', 'age', 'class']

dataframe = pandas.read_csv(url, names=names)

array = dataframe.values

X = array[:,0:8]

Y = array[:,8]

test_size = 0.33

seed = 7

X_train, X_test, Y_train, Y_test = model_selection.train_test_split(X, Y, test_size=test_size, random_state=seed)

model = LogisticRegression(solver='lbfgs', max_iter=120)

model.fit(X_train, Y_train)

predicted = model.predict(X_test)

report = classification_report(Y_test, predicted)

print(report)

(.env) [boris@fedora34server YANDEXQ]$ python predict.py

              precision    recall  f1-score   support


         0.0       0.81      0.88      0.84       162

         1.0       0.74      0.63      0.68        92


    accuracy                           0.79       254

   macro avg       0.78      0.75      0.76       254

weighted avg       0.78      0.79      0.78       254


(.env) [boris@fedora34server YANDEXQ]$ cat regres01.py

import pandas

from sklearn import model_selection

from sklearn.linear_model import LinearRegression

url = "https://raw.githubusercontent.com/jbrownlee/Datasets/master/housing.data"

names = ['CRIM', 'ZN', 'INDUS', 'CHAS', 'NOX', 'RM', 'AGE', 'DIS', 'RAD', 'TAX', 'PTRATIO', 'B', 'LSTAT', 'MEDV']

dataframe = pandas.read_csv(url, delim_whitespace=True, names=names)

array = dataframe.values

X = array[:,0:13]

Y = array[:,13]

seed = 7

kfold = \ model_selection.KFold(n_splits=10,shuffle=True,random_state=seed)

model = LinearRegression()

scoring = 'neg_mean_absolute_error'

results = model_selection.cross_val_score(model, X, Y, cv=kfold, scoring=scoring)

print(("MAE: %.3f (%.3f)") % (results.mean(), results.std()))

(.env) [boris@fedora34server YANDEXQ]$ python regres01.py

MAE: -3.387 (0.667)

(.env) [boris@fedora34server YANDEXQ]$ cat regres02.py

# Cross Validation Regression MSE

import pandas

from sklearn import model_selection

from sklearn.linear_model import LinearRegression

url = "https://raw.githubusercontent.com/jbrownlee/Datasets/master/housing.data"

names = ['CRIM', 'ZN', 'INDUS', 'CHAS', 'NOX', 'RM', 'AGE', 'DIS', 'RAD', 'TAX', 'PTRATIO', 'B', 'LSTAT', 'MEDV']

dataframe = pandas.read_csv(url, delim_whitespace=True, names=names)

array = dataframe.values

X = array[:,0:13]

Y = array[:,13]

seed = 7

kfold = \ model_selection.KFold(n_splits=10,shuffle=True,random_state=seed)

model = LinearRegression()

scoring = 'neg_mean_squared_error'

results = model_selection.cross_val_score(model, X, Y, cv=kfold, scoring=scoring)

print(("MSE: %.3f (%.3f)") % (results.mean(), results.std()))

(.env) [boris@fedora34server YANDEXQ]$ python regres02.py

MSE: -23.747 (11.143)


(.env) [boris@fedora34server YANDEXQ]$ cat regres03.py
import pandas
from sklearn import model_selection
from sklearn.linear_model import LinearRegression
url = "https://raw.githubusercontent.com/jbrownlee/Datasets/master/housing.data"
names = ['CRIM', 'ZN', 'INDUS', 'CHAS', 'NOX', 'RM', 'AGE', 'DIS', 'RAD', 'TAX', 'PTRATIO', 'B', 'LSTAT', 'MEDV']

dataframe = pandas.read_csv(url, delim_whitespace=True, names=names)

array = dataframe.values

X = array[:,0:13]
Y = array[:,13]

seed = 7
kfold    \ =  model_selection.KFold(n_splits=10,shuffle=True,random_state=seed)

model = LinearRegression()

scoring = 'r2'

results = model_selection.cross_val_score(model, X, Y, cv=kfold, scoring=scoring)

print(("R^2: %.3f (%.3f)") % (results.mean(), results.std()))

(.env) [boris@fedora34server YANDEXQ]$ python regres03.py
R^2: 0.718 (0.099)


References

https://machinelearningmastery.com/metrics-evaluate-machine-learning-algorithms-python/