import numpy as np
import matplotlib.pyplot as plt
from mpl_toolkits.mplot3d import Axes3D
n = 1000
fig = plt.figure()
ax = fig.add_subplot(111, projection='3d')
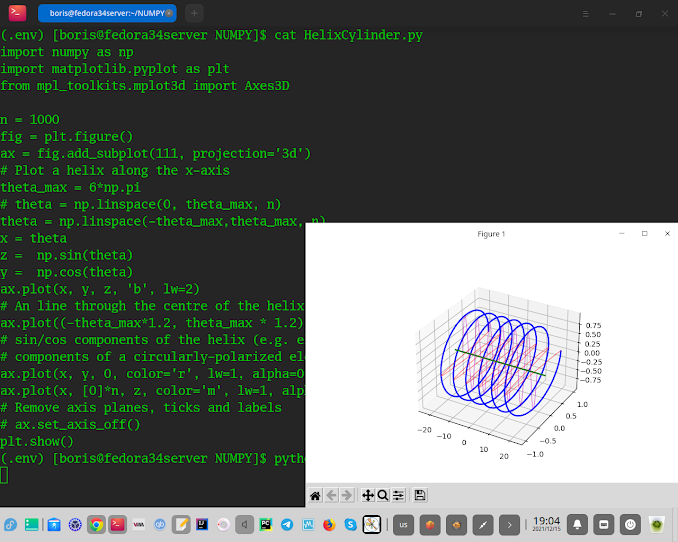
# Plot a helix along the x-axis
theta_max = 6*np.pi
# theta = np.linspace(0, theta_max, n)
theta = np.linspace(-theta_max,theta_max, n)
x = theta
z = np.sin(theta)
y = np.cos(theta)
ax.plot(x, y, z, 'b', lw=2)
# An line through the centre of the helix
ax.plot((-theta_max*1.2, theta_max * 1.2), (0,0), (0,0), color='g', lw=2)
# sin/cos components of the helix (e.g. electric and magnetic field
# components of a circularly-polarized electromagnetic wave
ax.plot(x, y, 0, color='r', lw=1, alpha=0.5)
ax.plot(x, [0]*n, z, color='m', lw=1, alpha=0.5)
# Remove axis planes, ticks and labels
# ax.set_axis_off()
plt.show()


No comments:
Post a Comment