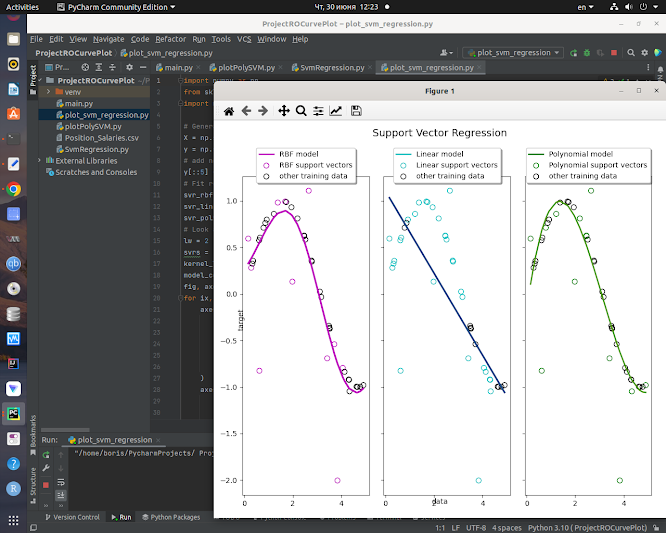
SVM-регрессия
Алгоритм SVM довольно универсален: он не только поддерживает линейную и нелинейную классификацию, но также поддерживает линейную и нелинейную регрессию. Хитрость заключается в том, чтобы изменить цель: вместо того, чтобы пытаться разместить максимально возможную улицу между двумя классами, ограничивая нарушения маржи, регрессия SVM пытается разместить как можно больше экземпляров на улице, ограничивая нарушения маржи (т.е. экземпляры за пределами улицы). . Ширина улицы контролируется определенным гиперпараметром .
Пример SVR(kernel='poly')
В машинном обучении полиномиальное ядро
является функцией ядра, обычно используемой с машинами опорных векторов (SVM) и другими ядерными моделями, которая представляет подобие векторов (обучающих выборок) в пространстве признаков над полиномами исходных переменных, позволяя изучать не-линейные модели. Интуитивно полиномиальное ядро рассматривает не только заданные характеристики входных выборок, чтобы определить их сходство, но и их комбинации. В контексте регрессионного анализа такие комбинации известны как признаки взаимодействия. Неявное пространство признаков полиномиального ядра эквивалентно пространству полиномиальной регрессии, но без комбинаторного увеличения количества параметров, которые необходимо изучить.
=====================
SVM-Regression sample
=====================
(.env) boris@boris-All-Series:~/VOTING/SVMREGRESSION$ cat SvmRegression.py
import numpy as np
import matplotlib.pyplot as plt
import pandas as pd
import warnings
warnings.filterwarnings("ignore")
# get the dataset
dataset = pd.read_csv('./Position_Salaries.csv')
print(dataset)
# split the data into featutes and target variable seperately
X_l = dataset.iloc[:, 1:-1].values # features set
y_p = dataset.iloc[:, -1].values # set of study variable
y_p = y_p.reshape(-1,1)
from sklearn.preprocessing import StandardScaler
StdS_X = StandardScaler()
StdS_y = StandardScaler()
X_l = StdS_X.fit_transform(X_l)
y_p = StdS_y.fit_transform(y_p)
# import the model
from sklearn.svm import SVR
# create the model object
regressor = SVR(kernel = 'rbf')
# fit the model on the data
regressor.fit(X_l, y_p)
# inverse the transformation to go back to the initial scale
plt.scatter(StdS_X.inverse_transform(X_l), StdS_y.inverse_transform(y_p), color = 'red')
plt.plot(StdS_X.inverse_transform(X_l), StdS_y.inverse_transform(regressor.predict(X_l).reshape(-1,1)), color = 'blue')
# add the title to the plot
plt.title('Support Vector Regression Model')
# label x axis
plt.xlabel('Position')
# label y axis
plt.ylabel('Salary Level')
# print the plot
plt.show()
(.env) boris@boris-All-Series:~/VOTING/SVMREGRESSION$ cat plot_svm_regression.py
"""
==============================================
Support Vector Regression (SVR) using linear and non-linear kernels
==============================================
"""
import numpy as np
from sklearn.svm import SVR
import matplotlib.pyplot as plt
# Generate sample data
X = np.sort(5 * np.random.rand(40, 1), axis=0)
y = np.sin(X).ravel()
# add noise to targets
y[::5] += 3 * (0.5 - np.random.rand(8))
# Fit regression model
svr_rbf = SVR(kernel="rbf", C=100, gamma=0.1, epsilon=0.1)
svr_lin = SVR(kernel="linear", C=100, gamma="auto")
svr_poly = SVR(kernel="poly", C=100, gamma="auto", degree=3, epsilon=0.1, coef0=1)
# Look at the results
lw = 2
svrs = [svr_rbf, svr_lin, svr_poly]
kernel_label = ["RBF", "Linear", "Polynomial"]
model_color = ["m", "c", "g"]
fig, axes = plt.subplots(nrows=1, ncols=3, figsize=(15, 10), sharey=True)
for ix, svr in enumerate(svrs):
axes[ix].plot(
X,
svr.fit(X, y).predict(X),
color=model_color[ix],
lw=lw,
label="{} model".format(kernel_label[ix]),
)
axes[ix].scatter(
X[svr.support_],
y[svr.support_],
facecolor="none",
edgecolor=model_color[ix],
s=50,
label="{} support vectors".format(kernel_label[ix]),
)
axes[ix].scatter(
X[np.setdiff1d(np.arange(len(X)), svr.support_)],
y[np.setdiff1d(np.arange(len(X)), svr.support_)],
facecolor="none",
edgecolor="k",
s=50,
label="other training data",
)
axes[ix].legend(
loc="upper center",
bbox_to_anchor=(0.5, 1.1),
ncol=1,
fancybox=True,
shadow=True,
)
fig.text(0.5, 0.04, "data", ha="center", va="center")
fig.text(0.06, 0.5, "target", ha="center", va="center", rotation="vertical")
fig.suptitle("Support Vector Regression", fontsize=14)
plt.show()
SVM-Classification sample
=====================
import matplotlib.pyplot as plt
from sklearn import svm, datasets
from sklearn.inspection import DecisionBoundaryDisplay
# import some data to play with
iris = datasets.load_iris()
# Take the first two features. We could avoid this by using a two-dim dataset
X = iris.data[:, :2]
y = iris.target
# we create an instance of SVM and fit out data. We do not scale our
# data since we want to plot the support vectors
C = 1.0 # SVM regularization parameter
models = (
svm.SVC(kernel="rbf", gamma=0.7, C=C),
svm.SVC(kernel="poly", degree=3, gamma="auto", C=C),
)
models = (clf.fit(X, y) for clf in models)
# title for the plots
titles = (
"SVC with RBF kernel",
"SVC with polynomial (degree 3) kernel",
)
# Set-up 2x1 grid for plotting.
fig, sub = plt.subplots(2, 1)
plt.subplots_adjust(wspace=0.4, hspace=0.4)
X0, X1 = X[:, 0], X[:, 1]
for clf, title, ax in zip(models, titles, sub.flatten()):
disp = DecisionBoundaryDisplay.from_estimator(
clf,
X,
response_method="predict",
cmap=plt.cm.coolwarm,
alpha=0.8,
ax=ax,
xlabel=iris.feature_names[0],
ylabel=iris.feature_names[1],
)
ax.scatter(X0, X1, c=y, cmap=plt.cm.coolwarm, s=20, edgecolors="k")
ax.set_xticks(())
ax.set_yticks(())
ax.set_title(title)
plt.show()


No comments:
Post a Comment