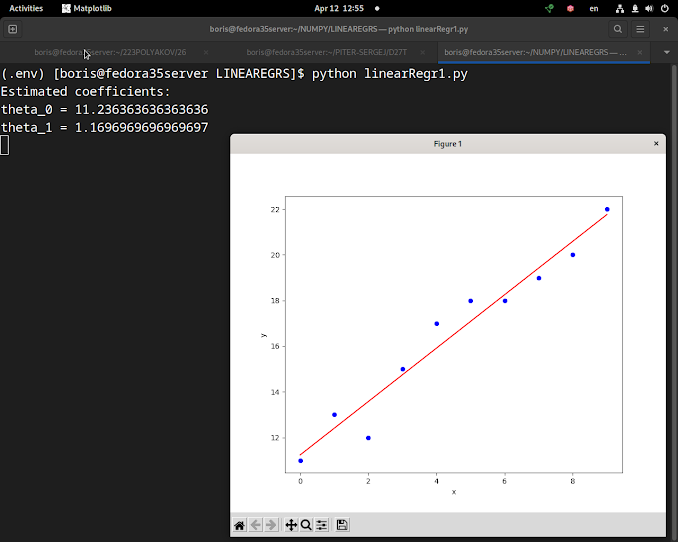
Code 1
(.env) [boris@fedora35server LINEAREGRS]$ cat linearRegr1.py
import numpy as np
import matplotlib.pyplot as plt
def estimate_coef(x, y):
n = np.size(x)
m_x, m_y = np.mean(x), np.mean(y)
SS_xy = np.sum(y*x) - n*m_y*m_x
SS_xx = np.sum(x*x) - n*m_x*m_x
theta_1 = SS_xy / SS_xx
theta_0 = m_y - theta_1*m_x
return(theta_0, theta_1)
def plot_regression_line(x, y, theta):
plt.scatter(x, y, color = "b",marker = "o", s = 30)
y_pred = theta[0] + theta[1]*x
plt.plot(x, y_pred, color = "r")
plt.xlabel('x')
plt.ylabel('y')
plt.show()
x = np.array([0, 1, 2, 3, 4, 5, 6, 7, 8, 9])
y = np.array([11 ,13, 12, 15, 17, 18, 18, 19, 20, 22])
theta = estimate_coef(x, y)
print("Estimated coefficients:\ntheta_0 = {} \ntheta_1 = {}".format(theta[0], theta[1]))
plot_regression_line(x, y, theta)
print(round(theta[0]+ theta[1]*11,4))


No comments:
Post a Comment