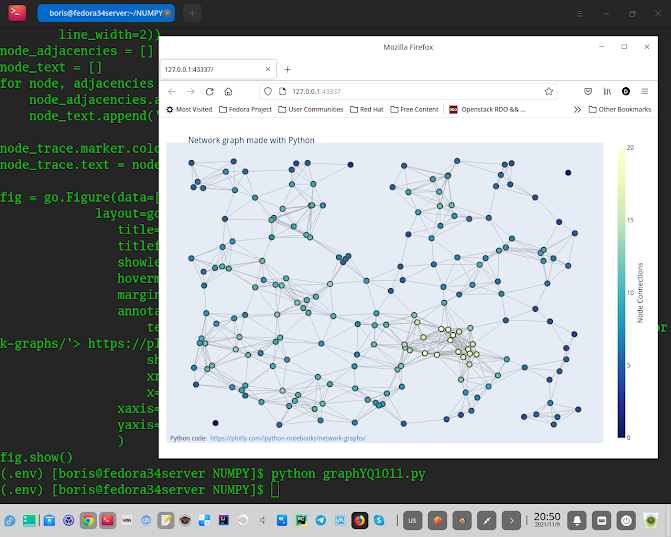
(.env) [boris@fedora34server NUMPY]$ cat graphYQ1011.py
import plotly.graph_objects as go
import networkx as nx
G = nx.random_geometric_graph(200, 0.125)
edge_x = []
edge_y = []
for edge in G.edges():
x0, y0 = G.nodes[edge[0]]['pos']
x1, y1 = G.nodes[edge[1]]['pos']
edge_x.append(x0)
edge_x.append(x1)
edge_x.append(None)
edge_y.append(y0)
edge_y.append(y1)
edge_y.append(None)
edge_trace = go.Scatter(
x=edge_x, y=edge_y,
line=dict(width=0.5, color='#888'),
hoverinfo='none',
mode='lines')
node_x = []
node_y = []
for node in G.nodes():
x, y = G.nodes[node]['pos']
node_x.append(x)
node_y.append(y)
node_trace = go.Scatter(
x=node_x, y=node_y,
mode='markers',
hoverinfo='text',
marker=dict(
showscale=True,
# colorscale options
#'Greys' | 'YlGnBu' | 'Greens' | 'YlOrRd' | 'Bluered' | 'RdBu' |
#'Reds' | 'Blues' | 'Picnic' | 'Rainbow' | 'Portland' | 'Jet' |
#'Hot' | 'Blackbody' | 'Earth' | 'Electric' | 'Viridis' |
colorscale='YlGnBu',
reversescale=True,
color=[],
size=10,
colorbar=dict(
thickness=15,
title='Node Connections',
xanchor='left',
titleside='right'
),
line_width=2))
node_adjacencies = []
node_text = []
for node, adjacencies in enumerate(G.adjacency()):
node_adjacencies.append(len(adjacencies[1]))
node_text.append('# of connections: '+str(len(adjacencies[1])))
node_trace.marker.color = node_adjacencies
node_trace.text = node_text
fig = go.Figure(data=[edge_trace, node_trace],
layout=go.Layout(
title='<br>Network graph made with Python',
titlefont_size=16,
showlegend=False,
hovermode='closest',
margin=dict(b=20,l=5,r=5,t=40),
annotations=[ dict(
text="Python code: <a href='https://plotly.com/ipython-notebooks/network-graphs/'> https://plotly.com/ipython-notebooks/network-graphs/</a>",
showarrow=False,
xref="paper", yref="paper",
x=0.005, y=-0.002 ) ],
xaxis=dict(showgrid=False, zeroline=False, showticklabels=False),
yaxis=dict(showgrid=False, zeroline=False, showticklabels=False))
)
fig.show()


No comments:
Post a Comment