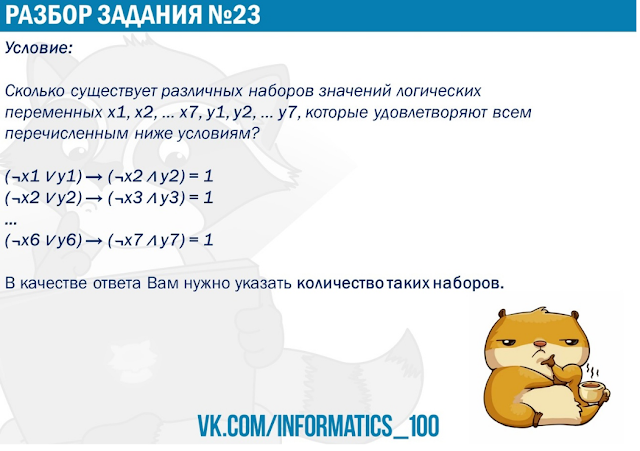
Original system per VK's News Wire Informatics_100
https://vk.com/doc201442577_528394217?hash=800896655a26dfa264&dl=b3b920ffa6ded30d68
First notice
The key place is a detailed description of building a cross-reference table
when moving to a new line of the system. The chart generation is just a consequence.
First consider system
(1) F1(x1,y1)=>F2(x2,y2) =1
(2) F1(x2,y2)=>F2(x3,y3) =1
(3) F1(x3,y3)=>F2(x4,y4) =1
(4) F1(x4,y4)=>F2(x5,y5) =1
(6) F1(x5,y5)=>F2(x6,y6) =1
(7) F1(x6,y6)=>F2(x7,y7) =1
where F1 and F2 are double predicates
Denote card(N) the power of set N
Denote n1,n2,m1,m2,s1,s2
n1=card (falseSet_F2 ∩ falseSet_F1)
n2=card (falseSet_F2 ∩ truthSet_F1)
m1=card (truthSet_F2 ∩ falseSet_F1)
m2=card (truthSet_F2 ∩ truthSet_F1)
s1=card (falseSet_F1)
s2=card (truthSet_F1)
See Setting up a cross-reference table in 08/2016 approach of Helen Mironchick when moving to a new line of the system of Boolean equations
for more details Then following 10.2019 diagram would show
Now fork 10.2019 chart


No comments:
Post a Comment